Many of the surveys Flowcheck perform incorporate the use of data loggers. Data loggers are simple yet versatile devices that enable a range of plant variables to be recorded at any instant in time. The data loggers can be used to record analogue values and they can be configured to capture status signals e.g. to indicate when a pump is running or stopped.
Data Logging Services
The data loggers can record at the same synchronised time interval or they can be programmed to capture specific events and log only during predefined times e.g. storm conditions.
All the information we capture on our data loggers is presented on spreadsheets, in Microsoft Excel format. This is more versatile and detailed than data viewed on site telemetry and Scada systems. Having all the data visible on a single spreadsheet, that can be viewed on a PC, enables the user to simply manipulate the information into the format required so that recorded data from different pieces of equipment can be viewed side by side. It also enables graphs to be plotted for any permutation of data for any chosen time period.
The ability to view chosen data in columns and on graphs helps gain a better understanding of what is happening within a plant or process and helps identify exact times when specific conditions occur.
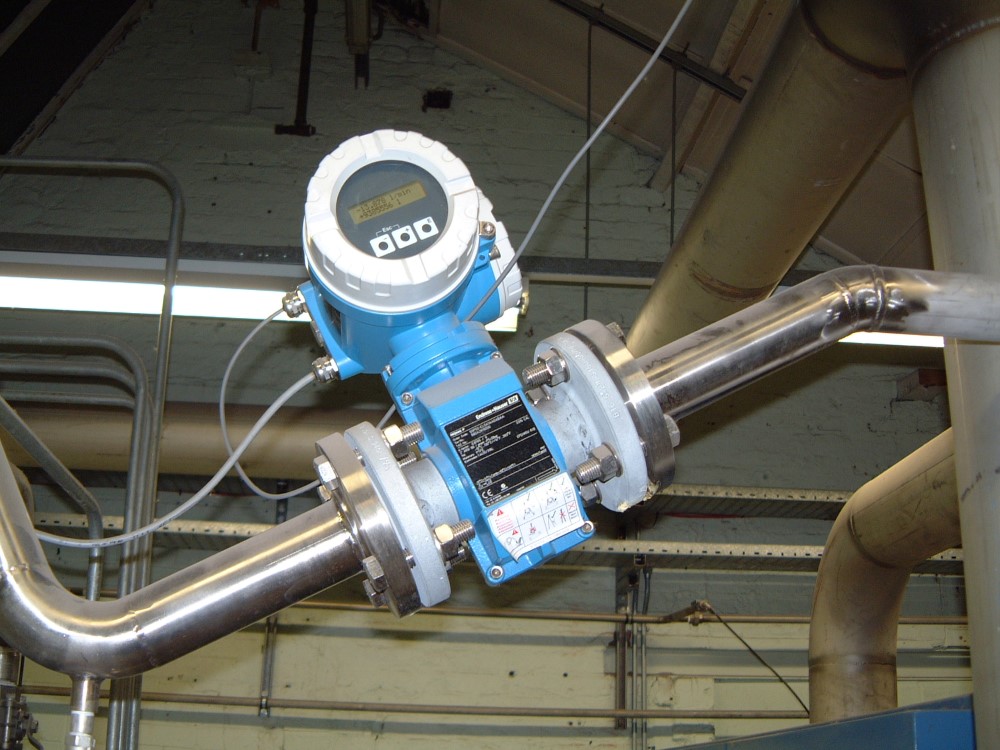
Our Engineers can connect data loggers to record the output signals from existing plant instrumentation or they can connect them to our own survey equipment, installed wherever needed on site. See Flow and load surveys.